为啥写这个
平日经常会分析shotgun宏基因组的数据,我们的pipeline使用MetaPhlAn,Kraken等profiler。这种数据经常会产生一个表格,如下:
download.file("https://github.com/biobakery/biobakery/raw/master/demos/biobakery_demos/data/metaphlan2/output/SRS014459-Stool_profile.txt", '~/Downloads/SRS014459-Stool_profile.txt')
knitr::kable(head(read.table('~/Downloads/SRS014459-Stool_profile.txt')))| V1 | V2 |
|---|---|
| k__Bacteria | 100.00000 |
| k__Bacteria|p__Firmicutes | 64.91753 |
| k__Bacteria|p__Bacteroidetes | 35.08247 |
| k__Bacteria|p__Firmicutes|c__Clostridia | 64.91753 |
| k__Bacteria|p__Bacteroidetes|c__Bacteroidia | 35.08247 |
| k__Bacteria|p__Firmicutes|c__Clostridia|o__Clostridiales | 64.91753 |
第一列是分类信息注释,第二列是相对丰度(百分比)。在做这种图可视化方面,目前个人见过最强大的是GraPhlAn:

官网上相关的教程很详细,但是问题是,这个完全封闭的python程序,想要hack,还真的是挺难得。Krona可能是另一个选择,但是同样还是会有同样的问题。最近发布的R包Metacoder,画出的图个人真心不是很喜欢:
跟Y叔讨论了一下用ggtree实现像GraPhlAn那样图的可能性,得到了肯定的答复,于是开始自己造轮子。
MicrobiomeViz–千里之行,始于足下
其实可以写一个简单的函数,但是还是想做一个拓展性更强的东西,所以就有了这个包(不断完善中): https://github.com/lch14forever/microbiomeViz
MetaPhlan结果的parser
安装
devtools::install_github("lch14forever/microbiomeViz", dependencies = T)## Skipping install of 'microbiomeViz' from a github remote, the SHA1 (3db1d3a6) has not changed since last install.
## Use `force = TRUE` to force installation使用
目前有三个函数:
parseMetaphlanTSV: 将MetaPhlAn的表格转换成tree格式tree.backbone: 做出树的骨架clade.anno: 高亮一个节点及其下属所有节点
这个其实是基于之前做桑基图时写的那些代码,将MetaPhlan表格转化为了phylobase的phylo4d类:
library(microbiomeViz)## Warning: replacing previous import 'ape::rotate' by 'ggtree::rotate' when
## loading 'microbiomeViz'data("SRS014459_Stool_profile") ## 上面的示例数据已经加如microbiomeViz
tr <- parseMetaphlanTSV(SRS014459_Stool_profile) ## parsing## Warning: `select_()` is deprecated as of dplyr 0.7.0.
## Please use `select()` instead.
## This warning is displayed once every 8 hours.
## Call `lifecycle::last_warnings()` to see where this warning was generated.## Warning: `as_data_frame()` is deprecated as of tibble 2.0.0.
## Please use `as_tibble()` instead.
## The signature and semantics have changed, see `?as_tibble`.
## This warning is displayed once every 8 hours.
## Call `lifecycle::last_warnings()` to see where this warning was generated.基于ggtree的大戏
做出树的骨架
p <- tree.backbone(tr)## Warning: `data_frame()` is deprecated as of tibble 1.1.0.
## Please use `tibble()` instead.
## This warning is displayed once every 8 hours.
## Call `lifecycle::last_warnings()` to see where this warning was generated.## Warning: `mutate_()` is deprecated as of dplyr 0.7.0.
## Please use `mutate()` instead.
## See vignette('programming') for more help
## This warning is displayed once every 8 hours.
## Call `lifecycle::last_warnings()` to see where this warning was generated.p
微生物组常见的操作就是组间比较,我们可以向GraPhlAn那样把显著的节点高亮出来:
## 假设以下taxa在疾病组显著
anno.data <- data.frame(node=c("g__Roseburia", "c__Clostridia", "s__Bacteroides_ovatus"),
                       color='red', stringsAsFactors = FALSE)
p <- clade.anno(p, anno.data)
p
## Warning in max(sp.df$x, na.rm = TRUE): no non-missing arguments to max;
## returning -Inf## Warning in min(y): no non-missing arguments to min; returning Inf## Warning in max(y): no non-missing arguments to max; returning -Inf## Warning in max(sp.df$x, na.rm = TRUE): no non-missing arguments to max;
## returning -Inf## Warning in min(y): no non-missing arguments to min; returning Inf## Warning in max(y): no non-missing arguments to max; returning -Inf## Warning in max(sp.df$x, na.rm = TRUE): no non-missing arguments to max;
## returning -Inf## Warning in min(y): no non-missing arguments to min; returning Inf## Warning in max(y): no non-missing arguments to max; returning -Inf## Warning in max(sp.df$x, na.rm = TRUE): no non-missing arguments to max;
## returning -Inf## Warning in min(y): no non-missing arguments to min; returning Inf## Warning in max(y): no non-missing arguments to max; returning -Inf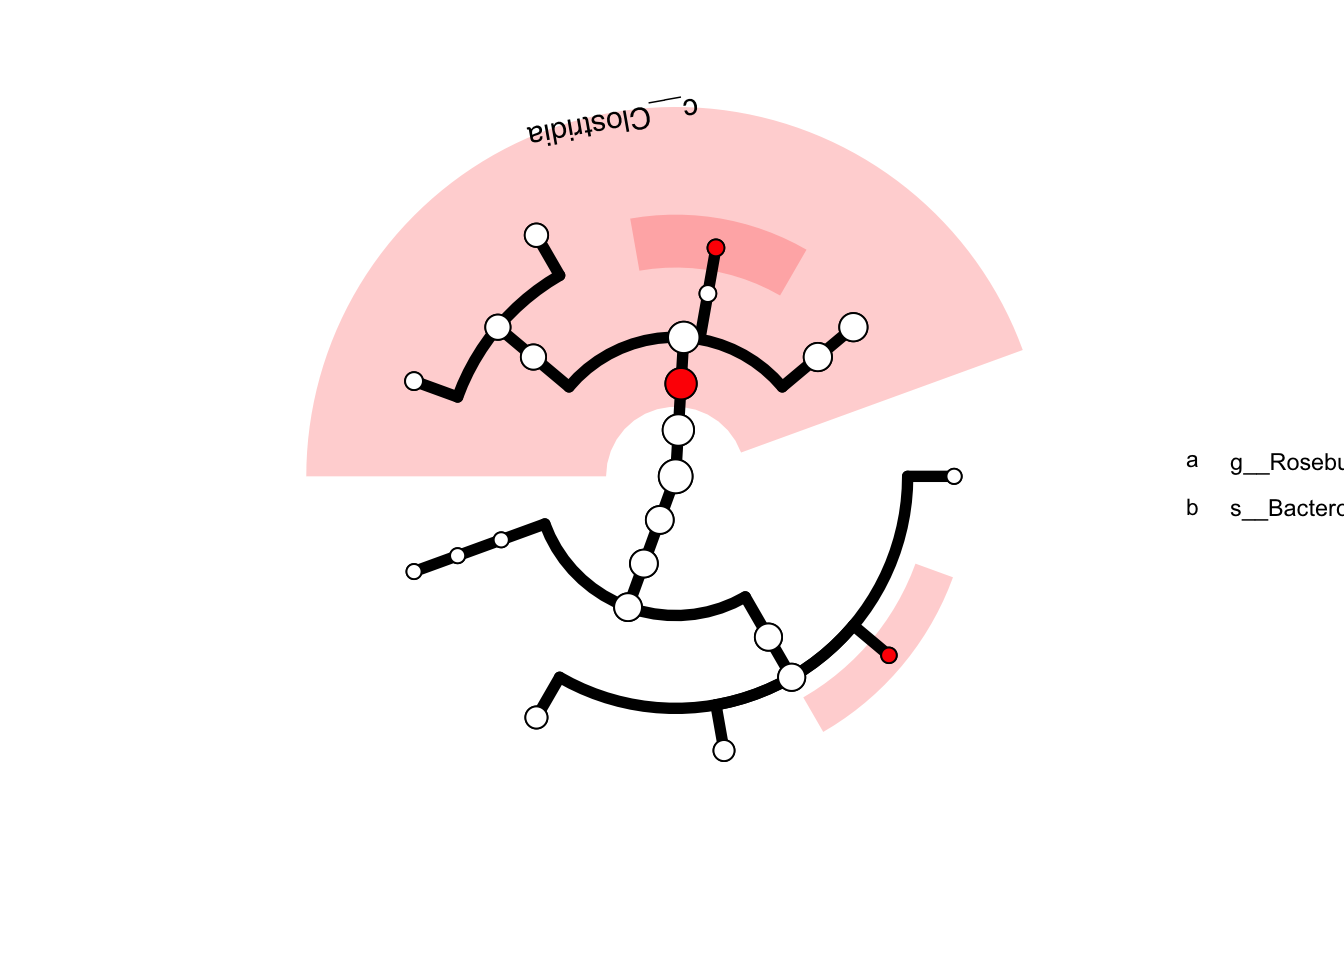
希望有更多的拓展
所有的操作均基于treedata和ggtree,正因为有了这些灵活的框架,上面的几个例子可拓展性还是很强的。
- 多个MetaPhlan表,节点大小取平均
- Biom数据支持
- 和heatmap结合
- …