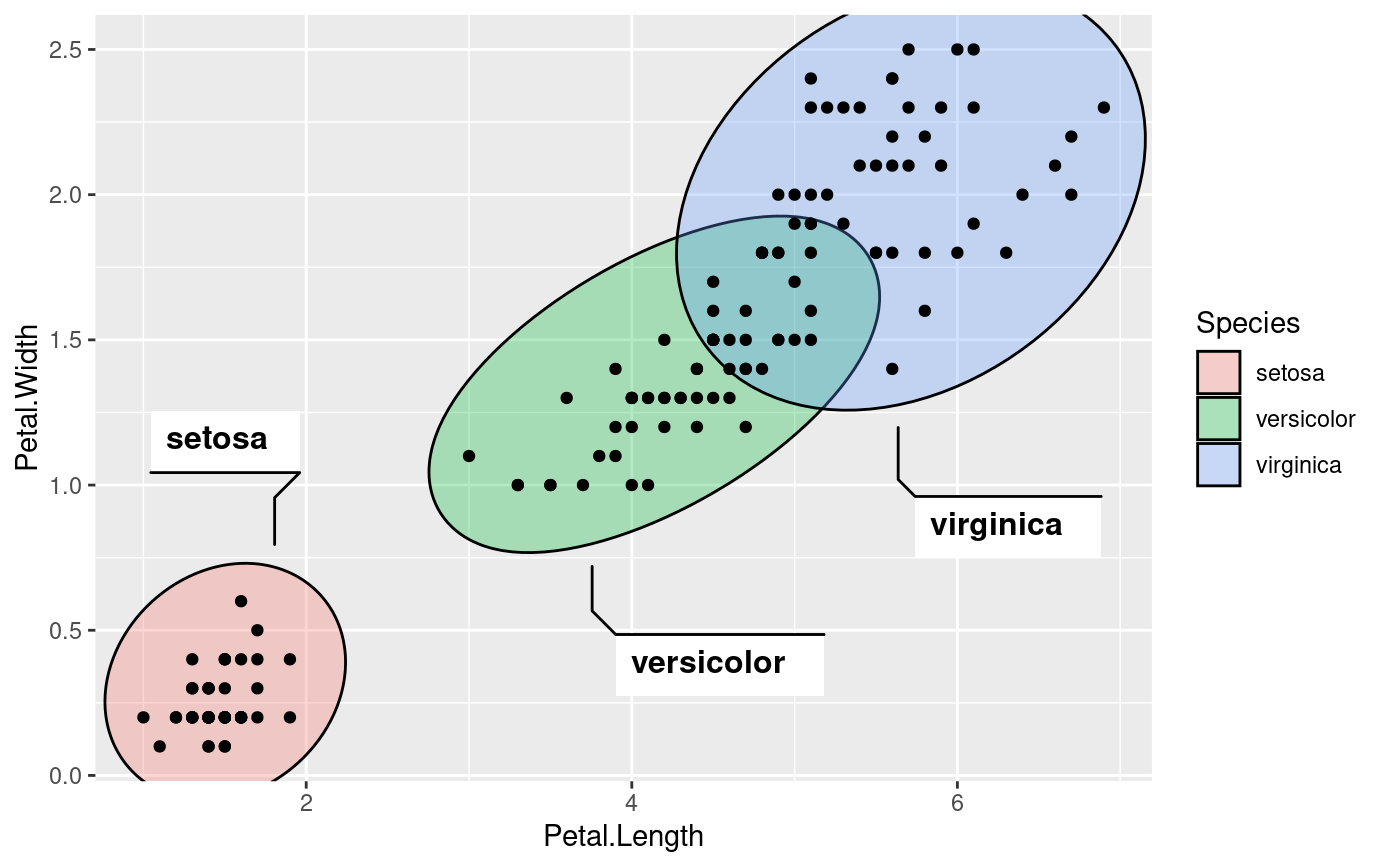
最近在画UMAP的时候发现有的时候细胞亚群的注释与点重合颜色上不是很搭配,同事提出让注释“支棱”起来,首先想到的是ggforce中的geom_mark_ellipse,实践中遇到一些问题,于是有了第一篇Single cell的记录。

ggforee
尝试用ggforce注释
library(dplyr)
library(Seurat)
library(SeuratData)
library(patchwork)
library(ggforce)
##InstallData("pbmc3k")
data("pbmc3k")
points <-
data.frame(pbmc3k.final@reductions$umap@cell.embeddings, cluster=Idents(pbmc3k.final))
DimPlot(pbmc3k.final) +
geom_mark_ellipse(data=points, aes(x=UMAP_1, y=UMAP_2, label=cluster, col=cluster),
inherit.aes = F) +
NoLegend()
非常难看不是吗?因为有一些cluster(Naive CD4 T)存在异常值,ggforce中的函数会包含所有的点。所以应该将异常值去掉,这个方法有很多,我使用的是之前用到的置信椭圆的方法。
修改
思路如下:
- 对每一个cluster计算一个尽量小的置信椭圆
- 用置信椭圆上的点来画geom_mark_ellipse
points <-
  data.frame(pbmc3k.final@reductions$umap@cell.embeddings, cluster=Idents(pbmc3k.final))

## adapted from https://github.com/fawda123/ggord/blob/master/R/ggord.R
theta <- c(seq(-pi, pi, length = 50), seq(pi, -pi, length = 50))
circle <- cbind(cos(theta), sin(theta))

library(plyr)## ------------------------------------------------------------------------------## You have loaded plyr after dplyr - this is likely to cause problems.
## If you need functions from both plyr and dplyr, please load plyr first, then dplyr:
## library(plyr); library(dplyr)## ------------------------------------------------------------------------------##
## Attaching package: 'plyr'## The following objects are masked from 'package:dplyr':
##
## arrange, count, desc, failwith, id, mutate, rename, summarise,
## summarizeaux <- function(x, one, two, prob=0.8) {
if(nrow(x) <= 2) {
return(NULL)
}
sigma <- var(cbind(x[,one], x[,two]))
mu <- c(mean(x[,one]), mean(x[,two]))
ed <- sqrt(qchisq(prob, df = 2))
data.frame(sweep(circle %*% chol(sigma) * ed, 2, mu, FUN = '+'))
}
ell <- plyr::ddply(points, "cluster", aux, one="UMAP_1", two="UMAP_2")
DimPlot(pbmc3k.final) +
geom_mark_ellipse(data=ell, aes(x=X1, y=X2, label=cluster, col=cluster),
inherit.aes = F) +
NoLegend() ### 微调
下面就是进行一些微调,将椭圆缩小使注释指在亚群上更好的位置
## 调整prob参数
ell <- plyr::ddply(points, "cluster", aux, one="UMAP_1", two="UMAP_2", prob=0.1)
DimPlot(pbmc3k.final) +
  geom_mark_ellipse(data=ell, aes(x=X1, y=X2, label=cluster, col=cluster),
                    inherit.aes = F) +
  NoLegend()
把椭圆隐藏
把椭圆隐藏
DimPlot(pbmc3k.final) +
  geom_mark_ellipse(data=ell, aes(x=X1, y=X2, label=cluster, group=cluster),
                    color=NA,
                    inherit.aes = F) +
  NoLegend()
Voila!
彩蛋
我在ggesentials中写了theme_umap_ge函数,用来画UMAP的小坐标。
library(ggessentials)
DimPlot(pbmc3k.final) +
  theme_umap_ge(aes_x = "UMAP_1", aes_y = "UMAP_2")
运行信息
sessionInfo()## R version 4.0.5 (2021-03-31)
## Platform: x86_64-apple-darwin17.0 (64-bit)
## Running under: macOS Big Sur 10.16
##
## Matrix products: default
## BLAS: /Library/Frameworks/R.framework/Versions/4.0/Resources/lib/libRblas.dylib
## LAPACK: /Library/Frameworks/R.framework/Versions/4.0/Resources/lib/libRlapack.dylib
##
## locale:
## [1] en_US.UTF-8/en_US.UTF-8/en_US.UTF-8/C/en_US.UTF-8/en_US.UTF-8
##
## attached base packages:
## [1] stats graphics grDevices utils datasets methods base
##
## other attached packages:
## [1] ggessentials_0.1.0 plyr_1.8.6 ggforce_0.3.3
## [4] ggplot2_3.3.5 patchwork_1.1.1 pbmc3k.SeuratData_3.1.4
## [7] SeuratData_0.2.1 SeuratObject_4.0.2 Seurat_4.0.3
## [10] dplyr_1.0.7
##
## loaded via a namespace (and not attached):
## [1] Rtsne_0.15 colorspace_2.0-2 deldir_0.2-10
## [4] ellipsis_0.3.2 ggridges_0.5.3 rstudioapi_0.13
## [7] spatstat.data_2.1-0 farver_2.1.0 leiden_0.3.9
## [10] listenv_0.8.0 ggrepel_0.9.1 fansi_0.5.0
## [13] codetools_0.2-18 splines_4.0.5 knitr_1.33
## [16] polyclip_1.10-0 jsonlite_1.7.2 ica_1.0-2
## [19] cluster_2.1.1 png_0.1-7 uwot_0.1.10
## [22] shiny_1.6.0 sctransform_0.3.2 spatstat.sparse_2.0-0
## [25] compiler_4.0.5 httr_1.4.2 Matrix_1.3-4
## [28] fastmap_1.1.0 lazyeval_0.2.2 cli_3.0.1
## [31] tweenr_1.0.2 later_1.2.0 htmltools_0.5.1.1
## [34] tools_4.0.5 igraph_1.2.6 gtable_0.3.0
## [37] glue_1.4.2 RANN_2.6.1 reshape2_1.4.4
## [40] rappdirs_0.3.3 Rcpp_1.0.7 scattermore_0.7
## [43] jquerylib_0.1.4 vctrs_0.3.8 nlme_3.1-152
## [46] blogdown_1.4 lmtest_0.9-38 xfun_0.22
## [49] stringr_1.4.0 globals_0.14.0 mime_0.11
## [52] miniUI_0.1.1.1 lifecycle_1.0.0 irlba_2.3.3
## [55] goftest_1.2-2 future_1.21.0 MASS_7.3-53.1
## [58] zoo_1.8-9 scales_1.1.1 spatstat.core_2.3-0
## [61] promises_1.2.0.1 spatstat.utils_2.2-0 parallel_4.0.5
## [64] RColorBrewer_1.1-2 yaml_2.2.1 reticulate_1.20
## [67] pbapply_1.4-3 gridExtra_2.3 sass_0.4.0
## [70] rpart_4.1-15 stringi_1.7.3 highr_0.9
## [73] rlang_0.4.11 pkgconfig_2.0.3 matrixStats_0.60.0
## [76] evaluate_0.14 lattice_0.20-41 ROCR_1.0-11
## [79] purrr_0.3.4 tensor_1.5 labeling_0.4.2
## [82] htmlwidgets_1.5.3 cowplot_1.1.1 tidyselect_1.1.1
## [85] ggsci_2.9 parallelly_1.27.0 RcppAnnoy_0.0.19
## [88] magrittr_2.0.1 bookdown_0.23 R6_2.5.0
## [91] generics_0.1.0 withr_2.4.2 pillar_1.6.2
## [94] mgcv_1.8-34 fitdistrplus_1.1-5 survival_3.2-10
## [97] abind_1.4-5 tibble_3.1.3 future.apply_1.8.1
## [100] crayon_1.4.1 KernSmooth_2.23-18 utf8_1.2.2
## [103] spatstat.geom_2.2-2 plotly_4.9.4.1 rmarkdown_2.10
## [106] grid_4.0.5 data.table_1.14.0 digest_0.6.27
## [109] xtable_1.8-4 tidyr_1.1.3 httpuv_1.6.1
## [112] munsell_0.5.0 viridisLite_0.4.0 bslib_0.2.5.1