The model
## library
library('deSolve')
## GLV function
lvm <- function(t, x, params){
  with(as.list(params, c(x)), {
    dx <- alpha * x + x * (beta %*% x)
    list(dx)
  })
}

## numerical integration
n.integrate <- function(time, init.x, model, params){
    as.data.frame(ode(init.x, time, model, params))
}
## normalizations
TSS <- function(x){
  apply(x, 1, function(x)x/sum(x))
}
GLV with 3 species
alpha <- c(0.1, 0.2, 0.3)
beta <- t(matrix(c(-0.5, -0.3 ,   0,
                    0.1, -0.5 ,   0,
                     0 ,   0  , -0.5),
                 3,3 ))

init.x <- c(0.6, 1, 0.4)

dat <- n.integrate(0:10, init.x, lvm, list(alpha=alpha, beta=beta))
dat.norm <- t(TSS(dat[,-1]))

par(mfrow=c(1,2))
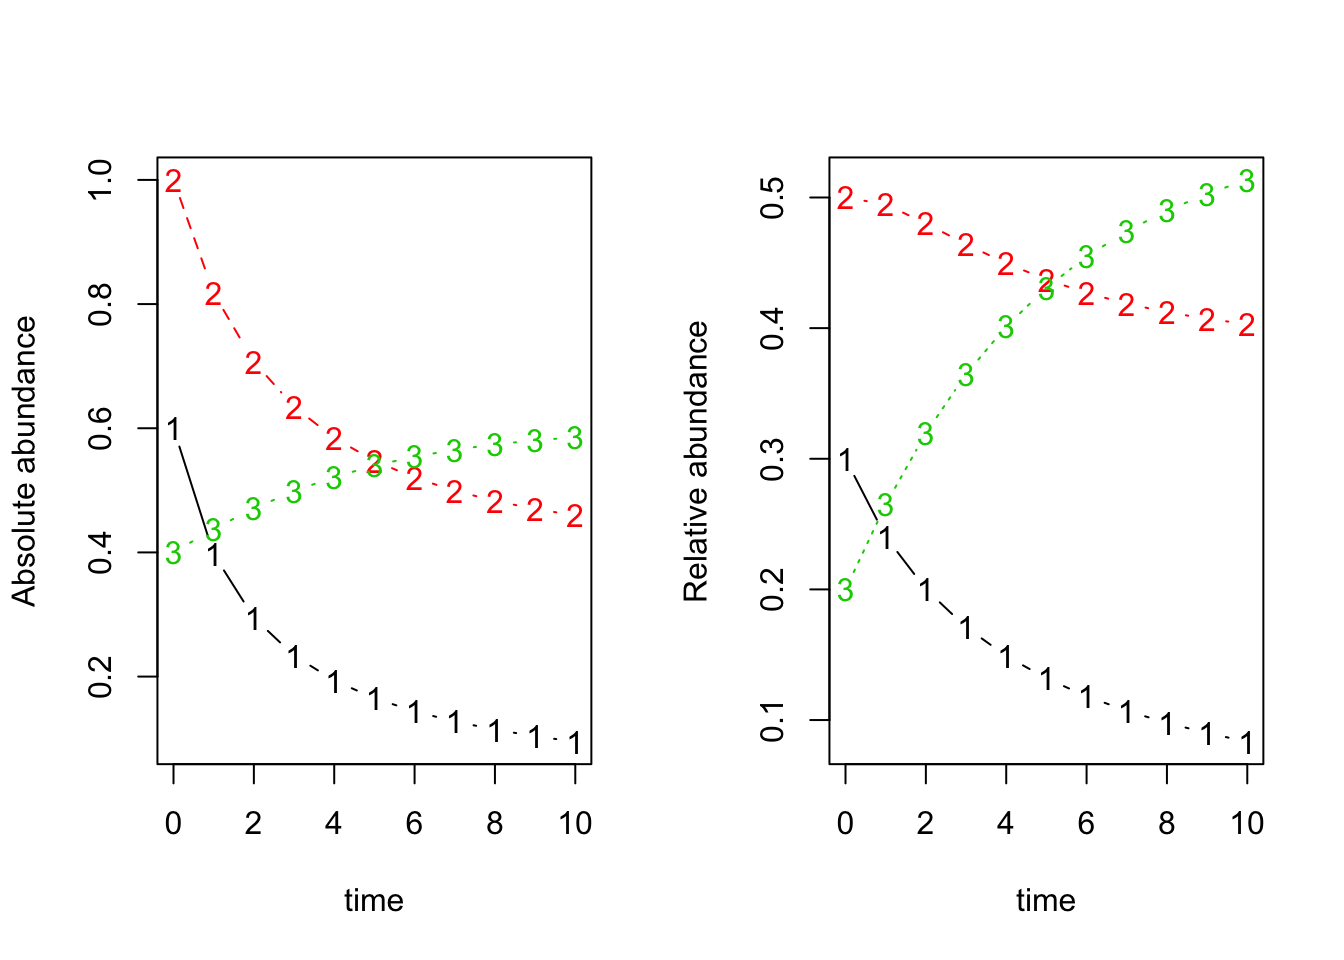
matplot(x=dat$time, y=dat[,-1], typ='b', xlab='time', ylab='Absolute abundance') ## absolute abundance
matplot(x=dat$time, y=dat.norm, typ='b', xlab='time', ylab='Relative abundance') ## relative abundance
Scale parameters
init.x.scaled <- init.x/sum(init.x)
beta.scaled <- beta * sum(init.x)

dat.w_scaled_beta <- n.integrate(0:10, init.x.scaled, lvm, list(alpha=alpha, beta=beta.scaled))
dat.norm.w_scaled_beta <- t(TSS(dat.w_scaled_beta[,-1]))

par(mfrow=c(1,2))
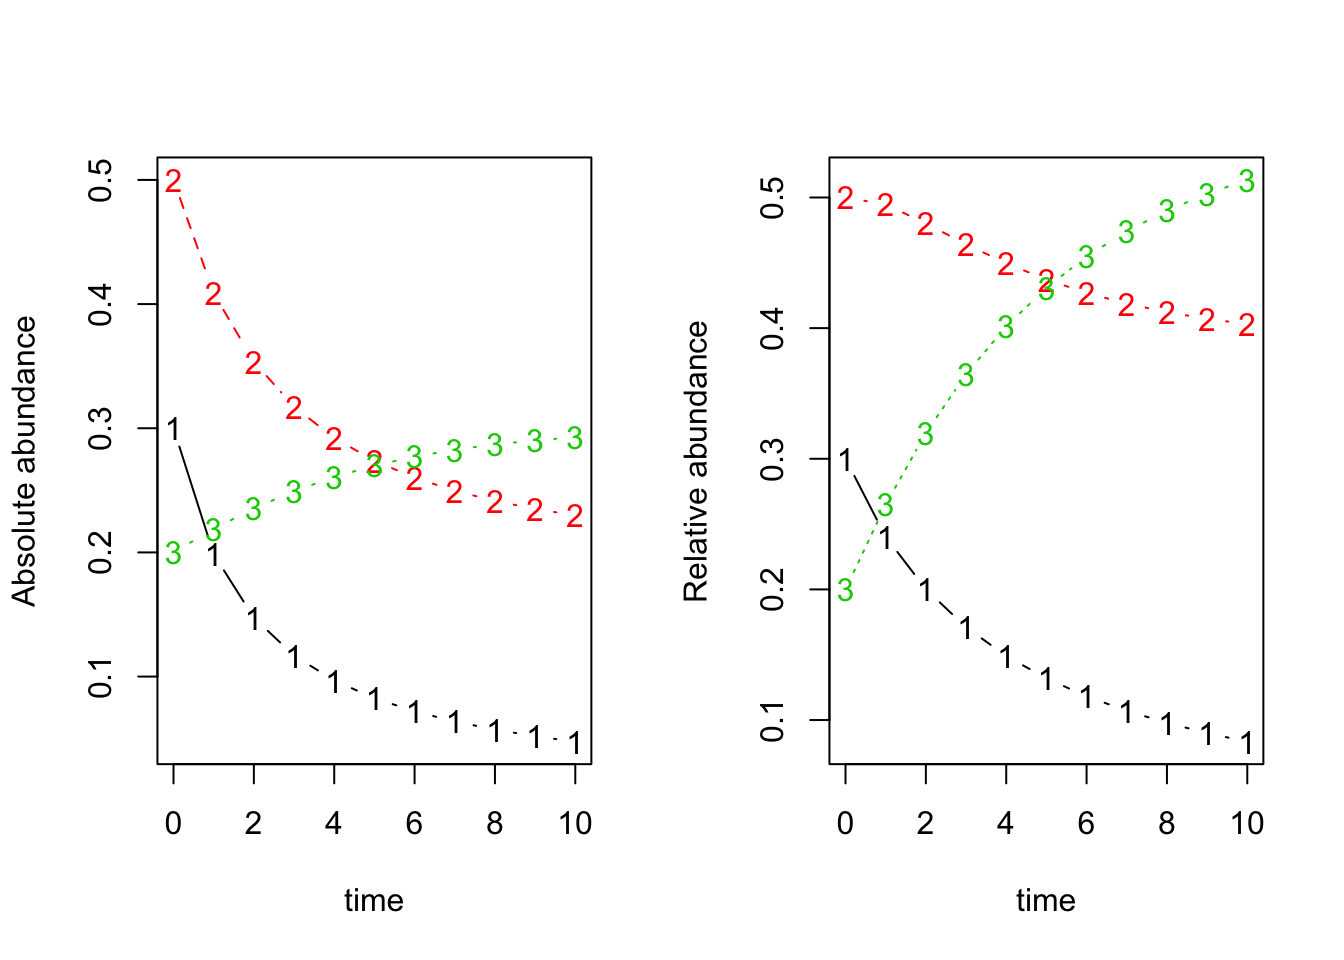
matplot(x=dat.w_scaled_beta$time, y=dat.w_scaled_beta[,-1], typ='b', xlab='time', ylab='Absolute abundance') ## absolute abundance
matplot(x=dat.w_scaled_beta$time, y=dat.norm.w_scaled_beta, typ='b', xlab='time', ylab='Relative abundance') ## relative abundance
Compare
par(mfrow=c(1,2))
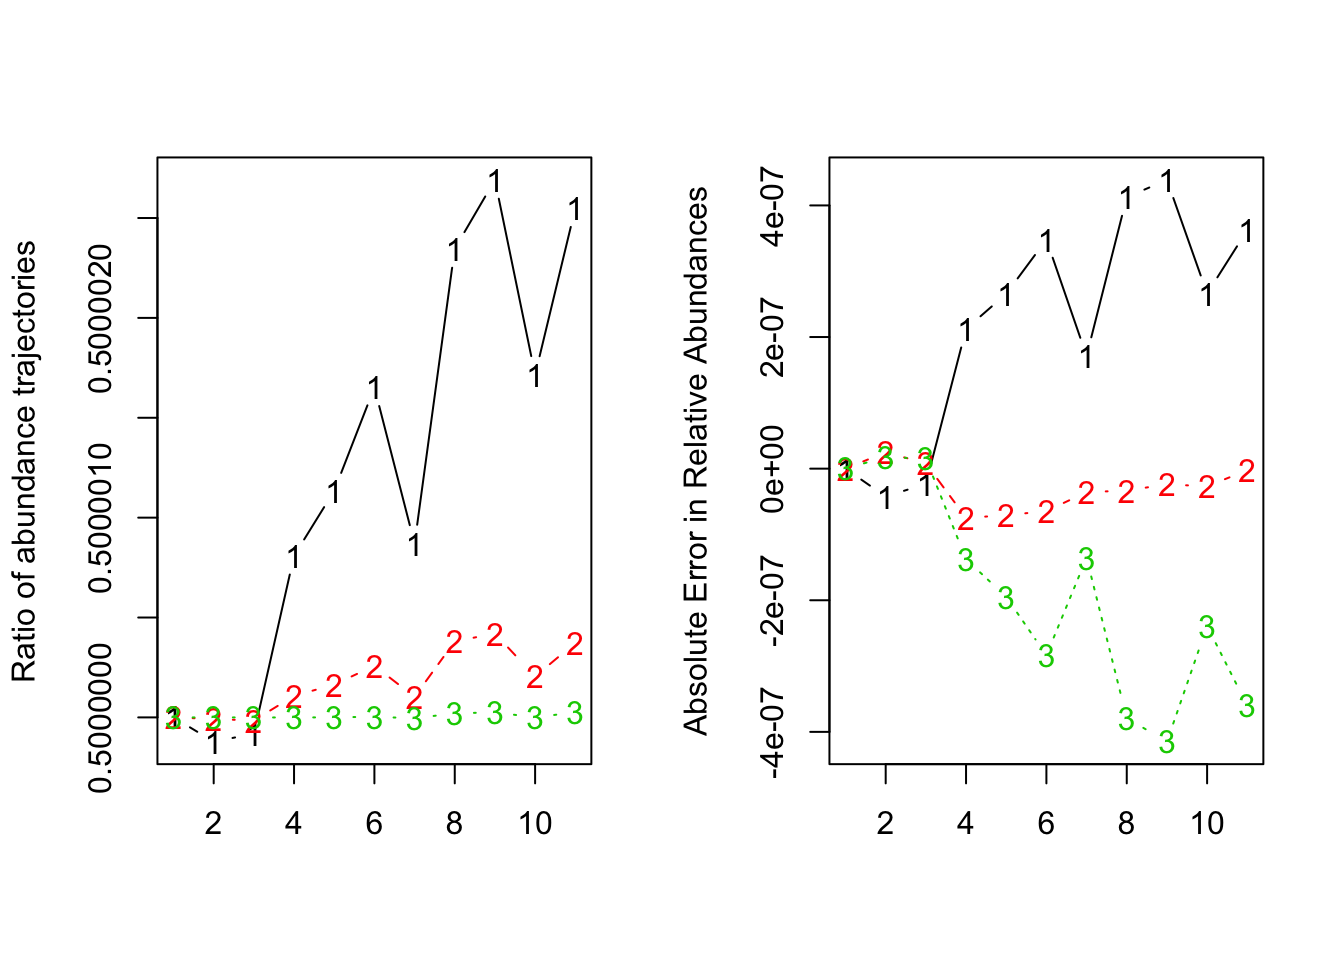
matplot(dat.w_scaled_beta[,-1]/dat[,-1], type='b', ylab='Ratio of abundance trajectories')
matplot(dat.norm.w_scaled_beta - dat.norm, type='b', ylab='Absolute Error in Relative Abundances')
Conclusion
It turned out that the GLV model could be scaled as long as the abundances and the interaction matrix were compatible (scale abundances by a factor of , then interaction matrix scaled by a factor of ).